Core Web Vitals Dashboard On Google Analytics
Start a Core Web Vital Real User Monitoring on Google Analytics

I am Bruno, a web developer for more than 12 years, mainly working on JavaScript, React, VueJS, HTML, CSS, UX and performance topics.
I spend my career mostly on consulting jobs, since I like to share and help other people to grow in their jobs. I'm currently working for (PlayPlay)[https://playplay.com/], a french company.
I was also a member of BDX I/O, a French non-profit organization that aims to propose a yearly conference about everything trending in the web technologies.
I like to share my discoveries and my expertise, that you will find here, on Hashnode, but also on my Twitter account, where I'm often posting small stories about the tech stuff I like.
I'm also a proud father, working on home automation on my spare time, reading about cognitive sciences and I like to cook.
I hope you will find all my posts here useful!
Core Web Vitals are a set of well-known metrics used to measure your website performance. It’s often the entry point to investigating what is wrong with someone’s website and measure the progress made optimizing the overall speed and stability.
Some of you (or your clients or employers) might not have the budget to invest into the various existing performance monitoring tools, or maybe no time to test and integrate them to the website, but they have a Google Analytics tracker set. With a few lines of code added, it is the perfect tool to start monitoring the performance experienced by the users when browsing the various pages of your web site.
Including the tracking code
In my example, I will be using Next.js which is a React SSR (server-side rendering) framework with a lot of internal optimizations, plus wonderful components such as <Image> and <Script> to improve the scripts and images loading and delaying/scheduling.
To extract the tracking part, I first have a reusable <Analytics> component which is responsible for including the two tags required by Google Analytics, and I’m using Next.js environment variables for the customization part.
With the hypothesis I have in the first paragraph, you may not need this to be included since your client is likely to already use Google Analytics tracking, but you can use it on new projects or existing ones without tracking system.
Reporting Core Web Vitals with Next.js also needs to add/update the _app.tsx file to add the metrics tracked and the page views tracked.
Once again, here is the code if you do not already have Google Analytics on the project.
There are two parts in the file to consider here:
- a
reportWebVitalsmethod that is automatically used by Next.js when it gets a Core Web Vital metric. If you are not using Next.js, you should look at the NPM web-vitals package to see the right method in your case. - a MyApp component that includes the
<Analytics>component presented earlier and a (bonus) hook to track the page change in Analytics. This one is to be used only if your client does not already have Google Analytics installed or you might duplicate the page change events sent to the server. You now just need to add your UA value to the.envfile or as an environment variableNEXT_PUBLIC_GOOGLE_ANALYTICSand you are ready!
Viewing data directly in Google Analytics
After few days collecting, you will see the events (in green on the screenshot) appearing in Google Analytics in the Behavior (in blue) > Events (in purple) > Top Events (in red) > Event action (in orange) menu.
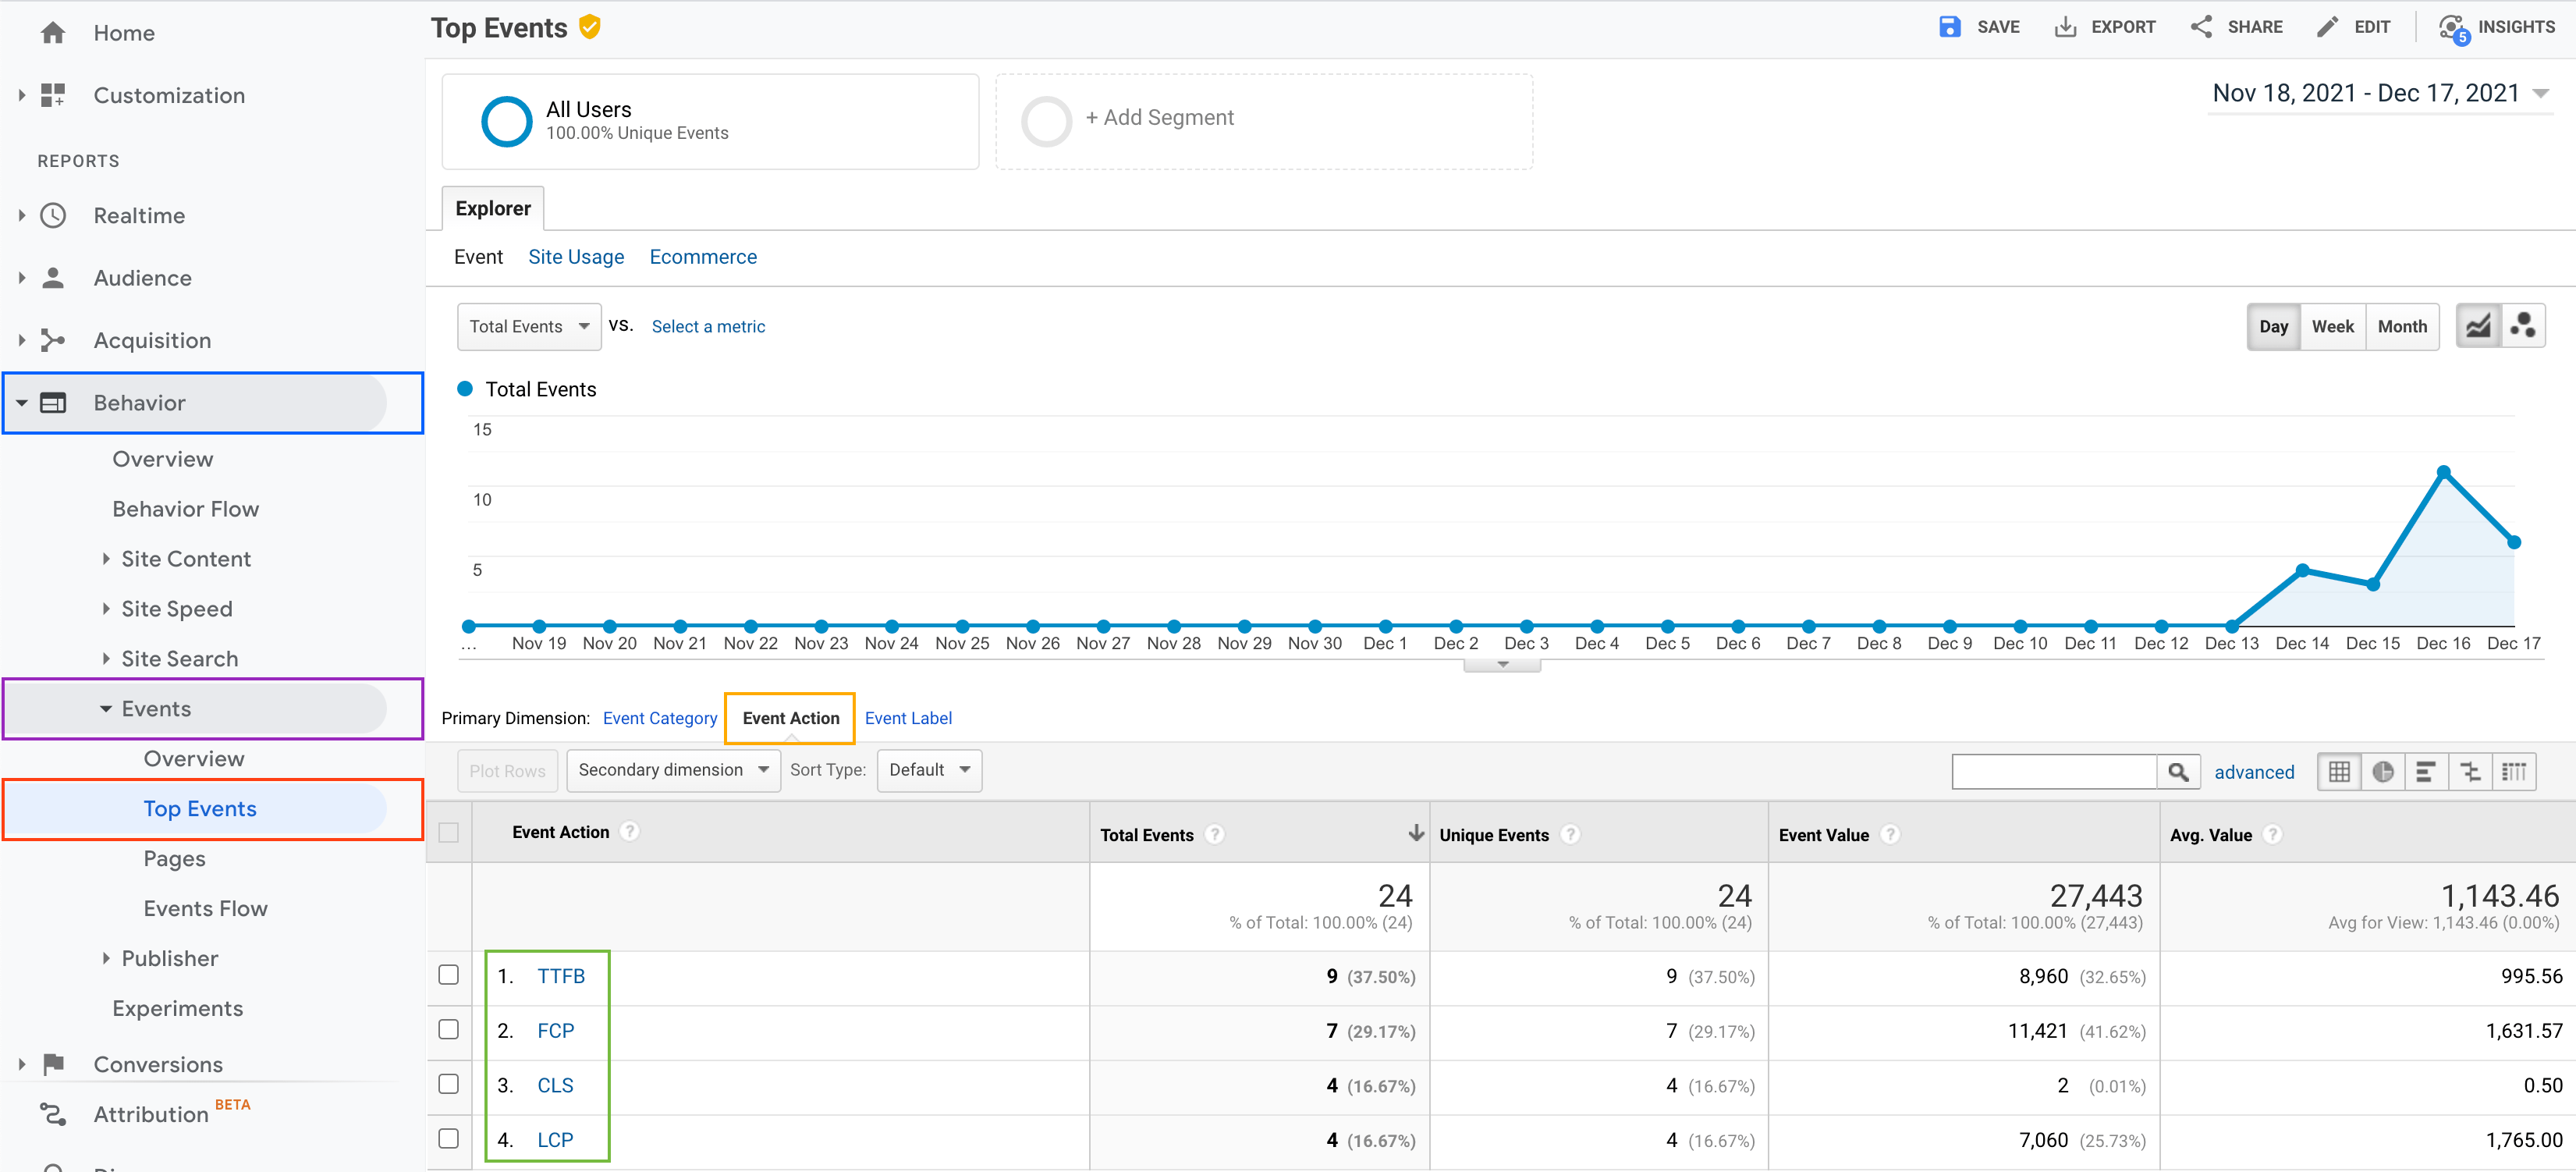
And voilà, now you can report the real performance usage to your client directly in Google Analytics.
Going further by creating custom dashboards If the previous screen give us the metrics, it is still a combined view where the chart shows all the metrics combined.
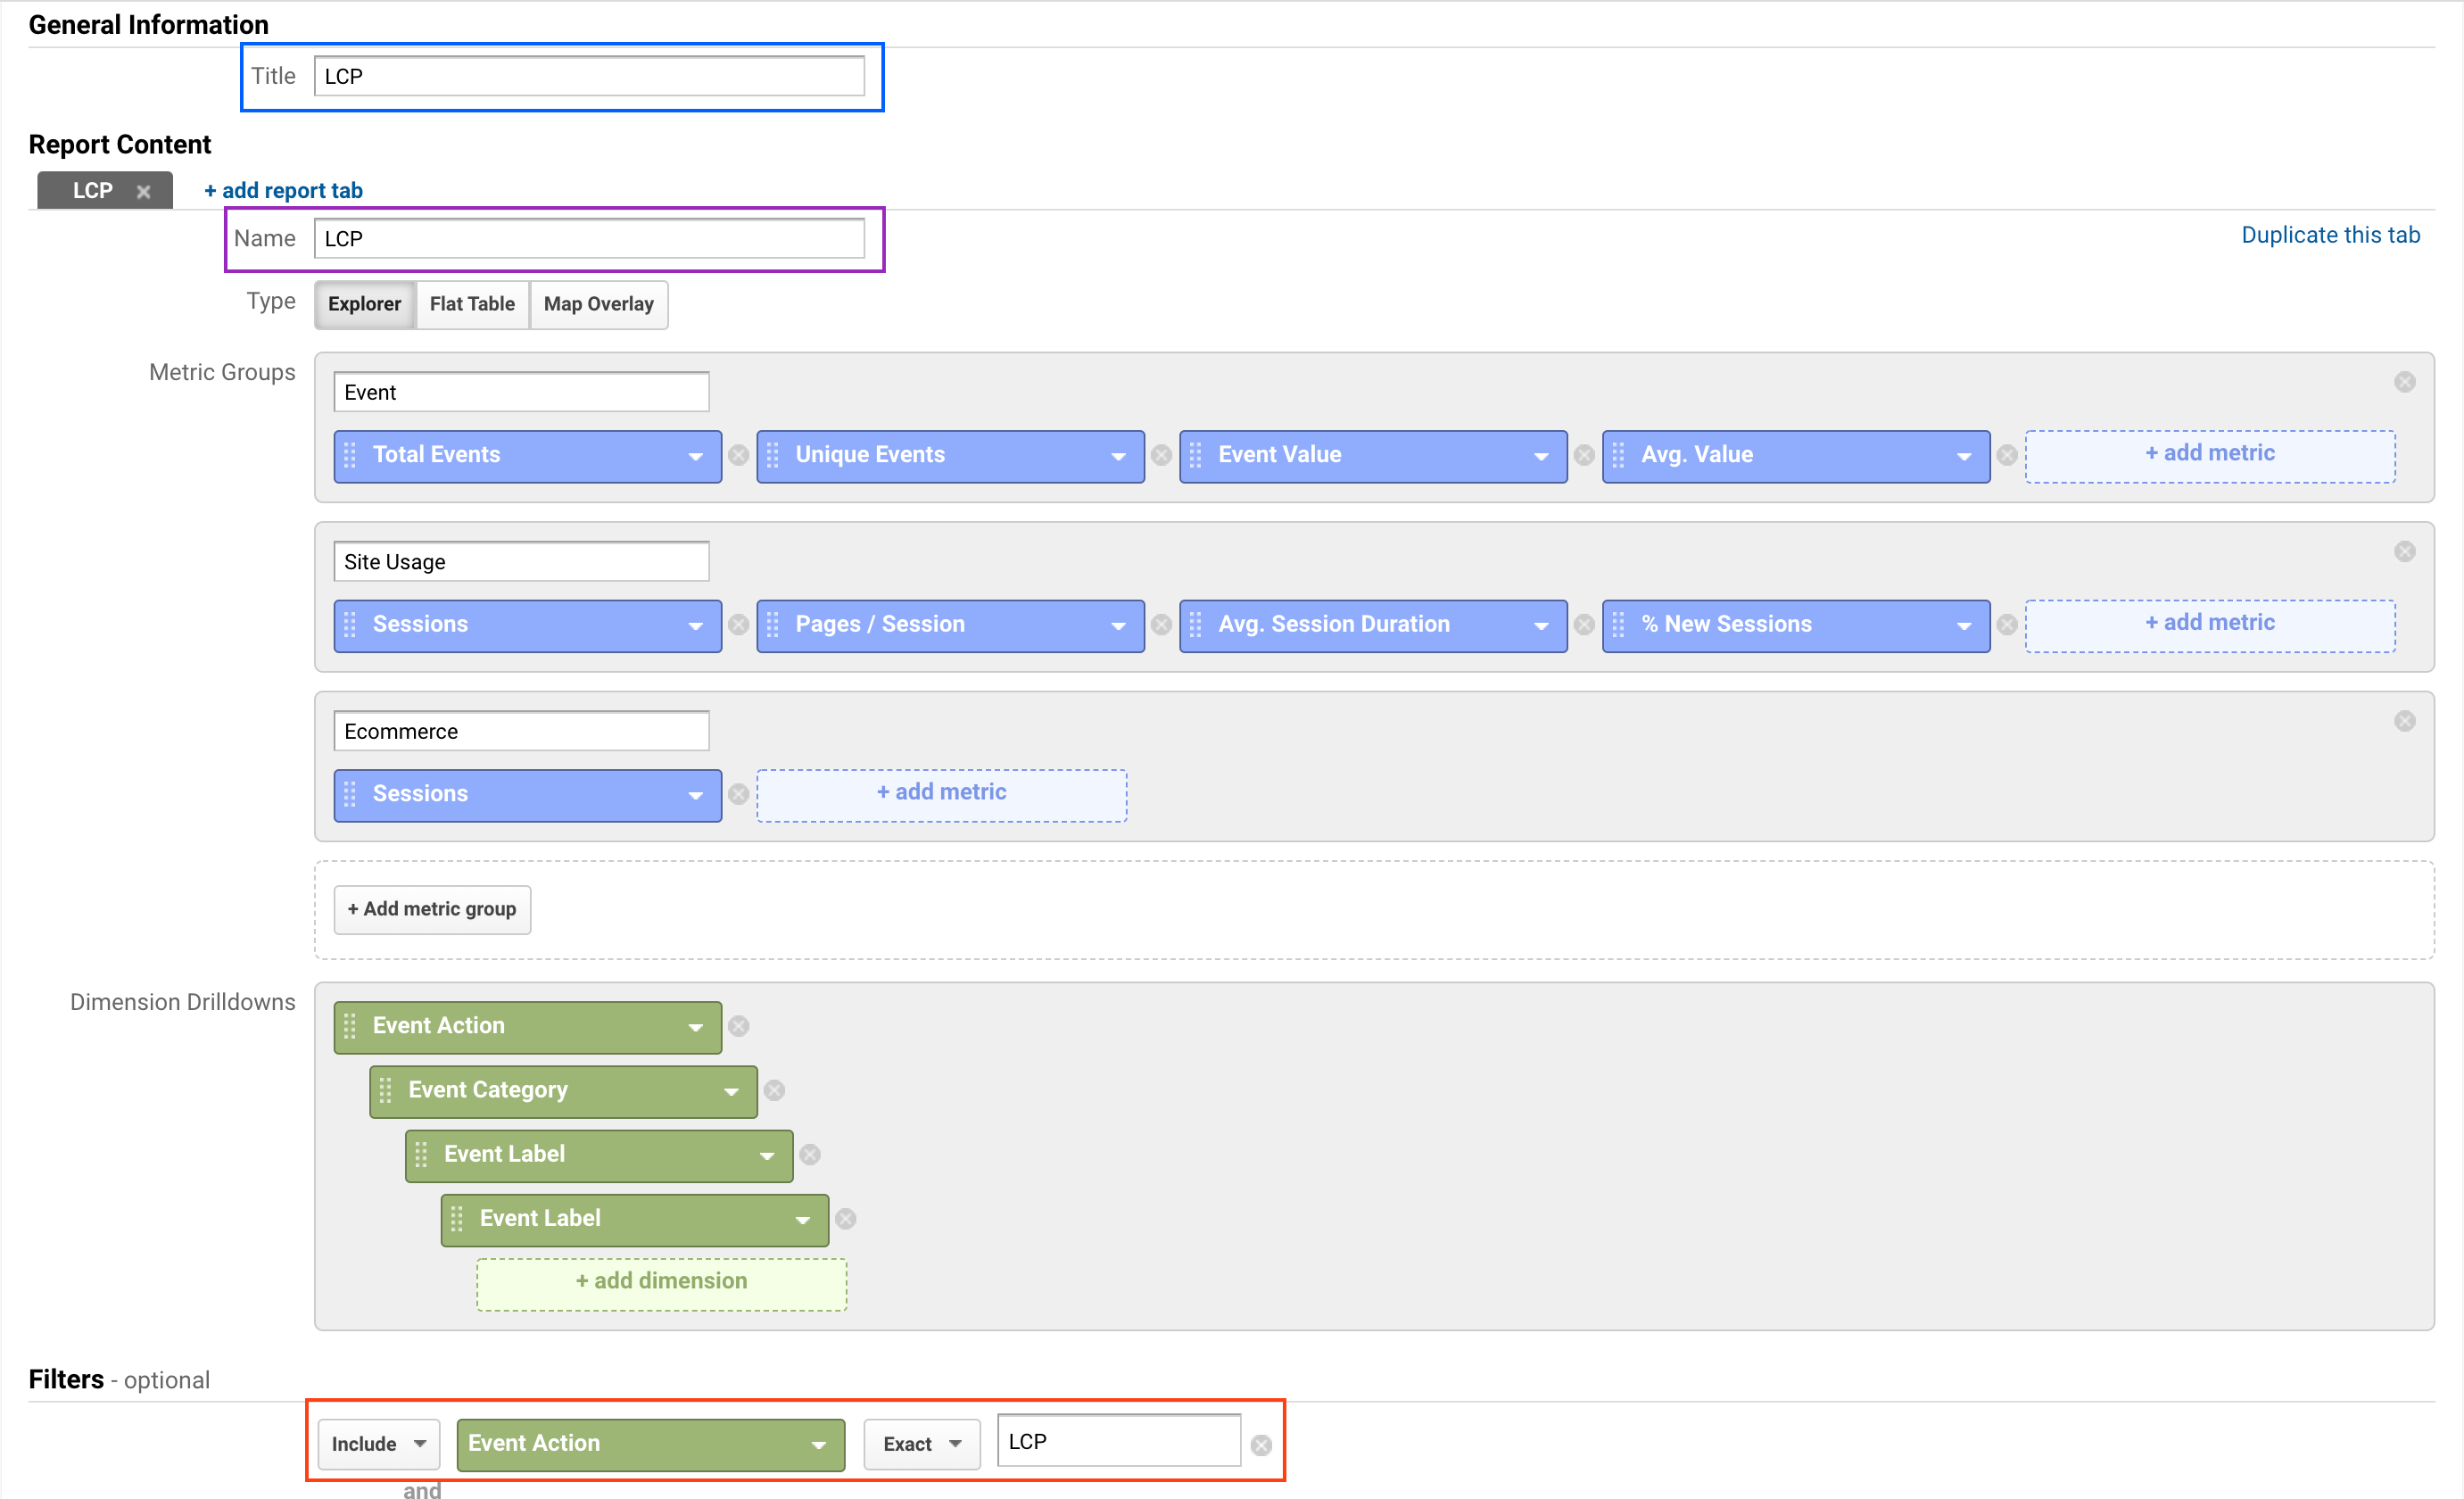
To have a very specific view for LCP, FID and CLS, we can create custom dashboard by clicking on the Edit button on the top right od the screen.
Once in the creation page, we need to update three block on the page:
- The Dashboard title (in blue)
- The Tab name (in purple)
- The filters (in red), to Include / Event Action / LCP
- Then press the Save button and you are done for the first metric!
You now just need to reproduce the previous steps for FID and CLS and you will have 3 custom reports with the Realtime User Monitoring (RUM) for your users!
Conclusion
Adding dashboard for Core Web Vitals in Google Analytics is an easy way to get a Realtime User Monitoring of your website performance.
If the created dashboard are too simple, you can go further thanks to Google Analytics power by adding second dimensions such as pages, device type, and even with conversion custom metrics.
Happy monitoring!


